The downward flux by the atmosphere is the same as the real greenhouse effect. This flux is excatly the same as the sum of four energy fluxes: LW radiation absorption 155.6 + SW radiation absotpion 75.0 + Latent heating 90.8 + 24.2 = 345.6 W/m2
ClimatExam Scientific analyses of the climate change and global warming by Dr. Antero Ollila


Average atmosphere
The profiles of the average global atmosphere
The author has used Spectral Calculator (see Scientific methods) in spectral analysis calculations. Because Spectral Calculator can use only a single atmosphere composition at a time, it is essential to define the average global atmosphere (AGA). There is a standard climate model for this in Spectral Calculator, but it is actually the U.S. standard atmosphere for the year 1976. While the gas concentration values are applicable for the year 1976, the water concentration turned out to only be approximately 55% of the true global actual values.
There is no generally accepted AGA model known to the author and that is why the AGA profiles had to be calculated. The calculations are based on the five available atmospheric models in SpectralCalc, which were originally produced by Ellingson et al.
The AGA values were calculated in a step-by-step process. The first step produced the average values for polar and mid-latitude atmospheres by averaging the summer and winter profiles. Then, the preliminary AGA profiles were produced by combining the three atmospheres according to their average geographical areas. One way of doing this is to define the tropical belt as being between 23.5 degrees North and South, the mid-latitudes as being from 23.5 degrees to 60 degrees and the Polar Regions as being between 60 and 90 degrees. By utilizing these definitions, the calculations produced weighting factors of 0.391, 0.461 and 0.148 for these regions. Finally, the weighting factors were fine-tuned to produce an average surface temperature of 288.2 K. After this fine-tuning, the following weighting factors were achieved: tropical climate 0.4, mid-latitude climate 0.45 and polar climate 0.15.
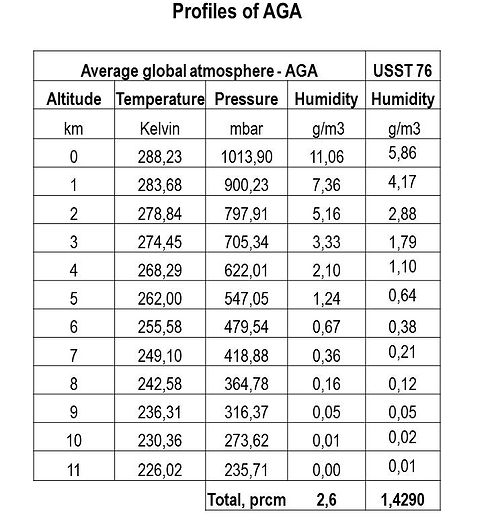
The author has used the polar summer atmosphere (PSA), because it is closest to the AGA values. Table 1 summarizes the AGA and PSA atmosphere profiles. Actually, the temperature profile for the PSA is 2.6 degrees colder than the one for the AGA profile and the pressure profile is 5.4 mbar lower than the AGA profile in the troposphere. The pressure profile cannot be adjusted and the difference has no practical impact. The temperature profile could be adjusted by a temperature off-set. Because the surface temperature is the same as the AGA value and 90% of the absorption takes place below 1 km, the PSA temperature profile has not been adjusted.
The AGA profile for water resulted in a total content of water in the troposphere of 2.69 prcm (precipitable water in centimetres). Miskolczi has calculated from TIGR (The Thermodynamic Initial Guess Retrieval) climatological balloon observation library and from NOAA (National Oceanic and Atmospheric Administration) data that the total precipitable water amount in the average global atmosphere is 2.6 cm. The calculated AGA water amount is only 3.5% higher than this value. Finally, the PSA water profile was adjusted to 2.6 prcm. In Table below, one can see all three profiles of AGA. There is also the humidity profile of U.S. Standard atmosphere 76 (USST 76). There is a huge difference in humidity values, and therefore, this atmosphere is not applicable for using in spectral calculations.
The greenhouse gas profiles are the same as used by IPCC for a specific year in question.
The AGA’s surface temperature is 15 °C, and the concentrations of the anthropogenic GH gases were measured in 2005 (AGA 2005) or in 2012 (AGA 2012). The GH gas concentrations (2005/2012) are: CO2 (379/393 ppm), CH4 (1.774/1.866 ppm), and N2O (0.319/0.324 ppm), as reported by IPCC and Blasing.