


The IPCC climate model corresponds perfectly to the measurement results - why?
- Oct 7, 2023
- 5 min read
Figure 1 shows the main elements of the IPCC climate model. The temperature change of 1.27 °C calculated by the IPCC models is practically the same as the measured temperature. The IPCC's GCM model seems to be perfect.
In the era of online scams, a new folk wisdom has emerged: If something seems too good to be true, it's not true. In this blog, I will show that this also applies to the IPCC's climate model. In my calculations, I use the IPCC's figures and models, so let's see how the IPCC's dogs bite.
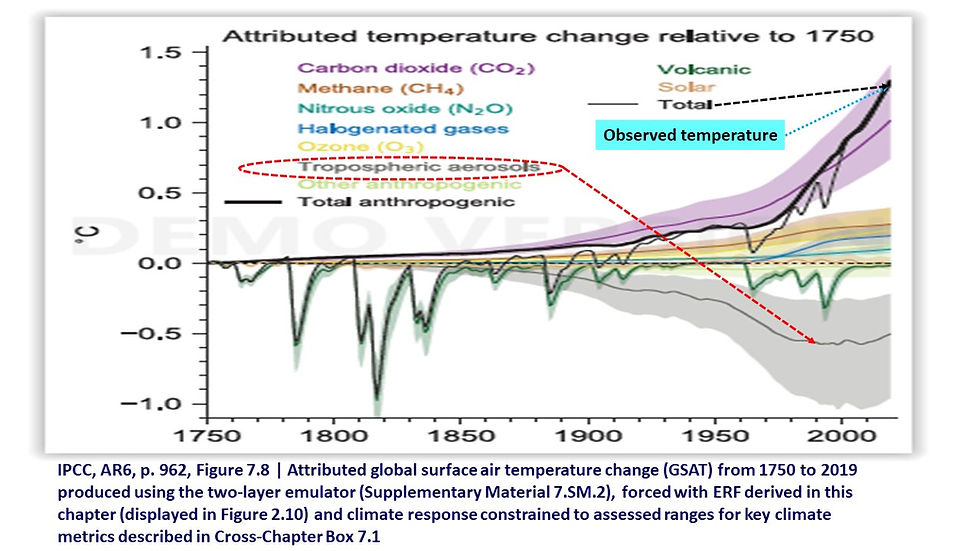
Figure 1. Main elements of the IPCC climate model according to Figure 7.8 of AR6. Observed and model-calculated (Total) temperature markings have been added as well as the marking of tropospheric aerosols.
.
As shown in Figure 1, carbon dioxide CO2 is the main temperature lifter. There is another key element in the picture that the IPCC does not want to talk about, it is usually ignored, and that is tropospheric aerosols, i.e. small particles in the atmosphere, including clouds. Aerosols decrease the temperature by 0.5 degrees, while CO2 raises it by about 1.0 degrees. Aerosols therefore play a significant role in the IPCC model and their impact is much greater than methane and nitrous oxide.
There are several reasons for the IPCC's silence. Firstly, the effect of aerosols on temperature is rather poorly known. Finnish climate researchers have specialised in aerosols. Professor Markku Kulmala and his colleagues at Helsinki University are still developing aerosol measurement techniques. Even today, there is no global aerosol measurement network.
The IPCC claims to know the impact of aerosols calculated from 1750 to 2019. You don't even need to have the expertise of a researcher to judge with common sense that the IPCC calculates the effect of aerosols using either the SHAKE or STETSON methods, i.e. Shake from the sleeve or pull out of a hat. The aerosol impact of -0.5 degrees hardly can be called even an "educated guess".
The manipulation of the IPCC's climate model can be easily verified from CERES data from the 2000s.
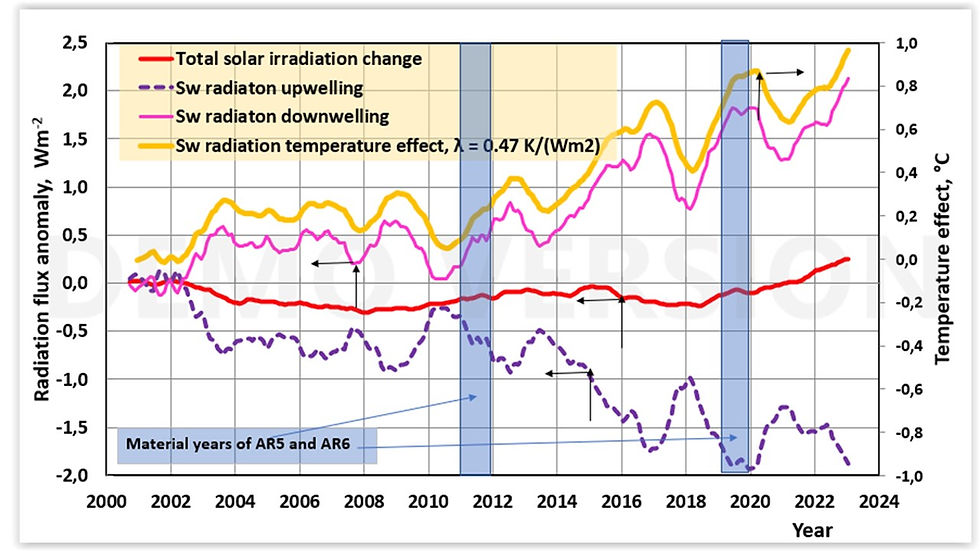
Figure 2. Based on CERES data, changes in total solar radiation (red curve), shortwave radiation reflected by the Earth (blue dashed line), net shortwave radiation received by Earth (SW radiation downwelling = dSW) (light red curve) and temperature effect of the latter radiation according to IPCC science (positive water feedback).
Figure 2 shows that the net amount of shortwave radiation received by the Earth (denoted dSW from now on) has started to grow strongly during the previous super El Nino in 2015-2016. Since then, there have been changes in the amount of dSW, but what is essential is a clear increase. The dSW curve of Loeb et al. is exactly similar to the SW radiation downwelling (= dSW) in Figure 2 and they found that changes in low cloud cover caused the SW radiation changes. The same curve can also be found in Figure 7.3 of AR6. Total solar radiation (TSI = Total Solar Irradiance) has varied according to sunspot cycles over periods of about 11 years, but currently, TSI is growing slightly.
Since I will be comparing the figures in the AR5 and AR6 reports, the figure shows the so-called material years in AR5 and AR6 reports; i.e. the reports calculate the values of climate variables for these years. The amount of shortwave radiation received by the Earth was 0.42 W/m2 in 2011 and 1.55 W/m2 in 2019, which means that the amount of solar radiation increased in eight years by 1.13 W/m2. This figure can be compared with the total change in radiative forcing (RF) of 0.44 W/m2 from 2011 to 2019. according to the AR5 and AR6. The key question is, how did the IPCC take into account this significant temperature-increasing change? It was omitted. Actually, the opposite happened, since the IPCC calculated that this factor decreased the temperature. The evidence comes from the tabular data in Figure 3.

Figure 3. IPCC reports AR5 and AR6 on radiative forcings caused by climate change by main categories and their temperature effects in 2019 (the reference year 1750).
The manipulation of the IPCC can be seen in Figure 3 under "Aerosols and cloud ". If the IPCC had taken this factor into account in the net amount of solar radiation in dSW, then it should be reflected in the numerical values Figure 3 shows that "Aerosols and cloud totally" was -0.8 W/m2 in 2011 and -1.0 W/m2 in 2019. According to the IPCC, the effect of clouds in aerosols has thus been a temperature-decreasing forcing of -0.18 W/m2 and a temperature impact of -0.09 degrees. This is not even a little bit, when CO2 was able to warm the climate by 0.22 degrees at the same time.
Then one can only analyse and speculate as to why the IPCC is doing this. A probable reason can be found in Figure 4. The yellow curve shown (the temperature effect) in Figures 2 and 5 has been calculated using the IPCC simple model
dT = λ * RF (1)
where dT is the change in surface temperature, λ is the climate sensitivity parameter, and RF is the change in radiative forcing. According to Figure 3, the climate sensitivity parameter value is 0.47 K/(W/m2), which means that the model includes positive water feedback, which is a “robust” feature of all GCMc. The functionality of equation (1) can be verified by comparing the TRC value, which is calculated to be 1.85 °C, and the IPCC value is 1.8 °C. Without this feedback, the value of λ is 0.27 K/(W/m2), which I have used in my model, reference 1.
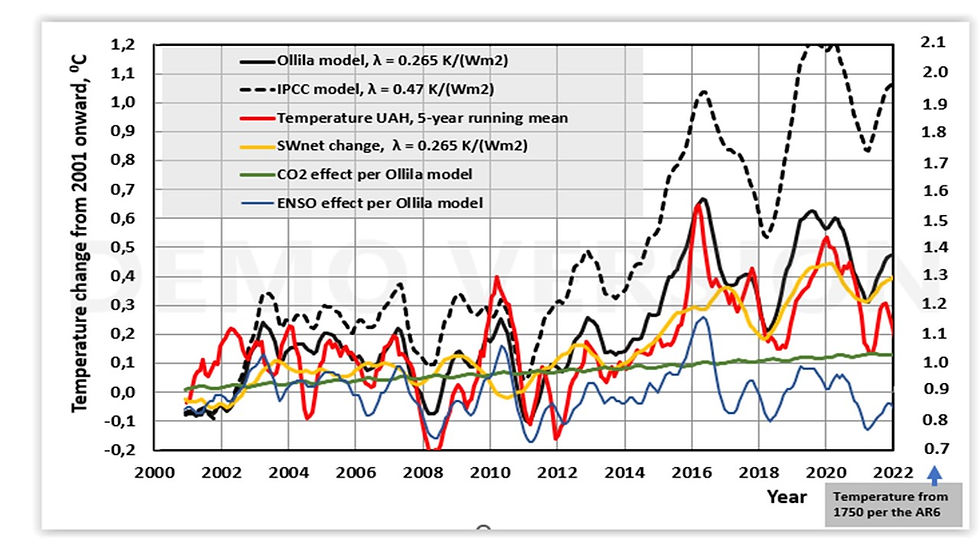
Figure 4. Warming calculations of the IPCC climate model and my own climate model from 2001 onwards, including the amount of net solar radiation received by the Earth, the effect of carbon dioxide and the effect of the ENSO effect.
The temperature increase given by the IPCC model, calculated by taking into account the increase in dSW of 1.61 W/m2 starting in 2001, which gives a temperature effect of 0.76 degrees, then in 2019 the temperature increase according to the IPCC model would have been 1.27 + 0.76 = 2.03 degrees. That is why the IPCC decided not to include this SW impact (or cloud impact).
I could dig into the IPCC's scientific faults from previous reports, such as the relevance of the 2005 model and the measured temperature when they also turned out to be equivalent. Then the values for 2011 were written in report AR5, and the model gave an RF value of 2.26 W/m2 and a corresponding temperature increase of 1.01 °C, which is about 38% higher than the reported measured temperature increase of 0.85 °C.
Then we came to 2019 and lo and behold, that error between the model and the measured temperature had practically disappeared. This fact was noted in the report in many words and figures, while in the report AR5, the big error was hidden and nothing was said about it. The media didn't write a word either.
Where was the change to such a significant improvement in equivalence? One might ask: did the model improve so much, or did nature begin to obey the IPCC's climate model? The explanation is that nature intervened, cloudiness decreased and the temperature rose almost completely according to the IPCC model when dSW was excluded. dSW actually increased the temperature dT = 0.27 * 1.61 = 0.44°C, which mainly explains the increase in surface temperature from 0.85°C in 2011 to about 1.3°C in 2019. So the IPCC took advantage of this actual temperature increase caused by shortwave radiation but omitted it from their model calculations because, in their way, the temperature would have exceeded 2.0°C. Although this factor has been there for all to see in the IPCC reports, it has not arised any attention.
Dr. Antero OIlila


Comments