

The great hoax of the composition of the atmospheric carbon dioxide
- Antero Ollila
- Sep 26, 2020
- 9 min read
Foreword
Cheating is based normally on an amazingly simple trick, which cannot be easily recognized. When cheating has been revealed, it seems so simple that deceived people are wondering why they could not notice it. When a hoax is something never done before, it is the most difficult to observe, because people are not aware. When it is a question about the scientific hoax, the alarm bells are not ringing at all. Ordinary people do not know the scientific facts behind a scientific phenomenon in question. I will reveal a scientific hoax using the mathematics of senior high school.
The composition of atmospheric CO2 according to climate establishment
People following the climate change news probably know at least one key figure indicating this change. It is the concentration increase of carbon dioxide (CO2) from 280 ppm in 1750 to the present level of about 412 ppm. The Anthropogenic Global Warming (AGW) theory of the IPCC is the enhanced greenhouse (GH) effect due to increased GH gas concentrations. Another frightening feature of the anthropogenic CO2 is the long residence time of this material in the atmosphere meaning that its concentration is exceedingly difficult to reduce, when it has once entered the atmosphere.
Wikipedia is a common source of information about the climate change and it writes like this: “Excess (author: anthropogenic) CO2 emitted since the pre-industrial era is projected to remain in the atmosphere for centuries to millennia, even after emissions stop. Even if human carbon dioxide emissions were to completely cease, atmospheric temperatures are not expected to decrease significantly for thousands of years”. The message is clear: anthropogenic CO2 is eviler than the natural CO2 because the humanity cannot get rid of it.
The actual composition of the atmospheric CO2 does not get any attention among climate researchers – not even among numerous skeptical web pages. I have noticed that there are two simple reasons for this. It is common knowledge among researchers and even among people interested in climate issues that about 55 % of yearly CO2 emissions seems to stay in the atmosphere and the rest is removed into the ocean and into the biosphere.
In AR5 (Ref. 1), the IPCC writes: “About half of the emissions remained in the atmosphere 240 PgC±10 PgC since 1750.” The IPCC refers to Joos et al. (Ref. 2), which states that “Currently, only about half of the anthropogenic CO2 emission stays airborne.” Here is a scientific confirmation that the atmospheric CO2 increase is anthropogenic by nature. These scientific sources do not refer to any CO2 composition measurements conforming finally these claims that the increase of the atmospheric CO2 amount from about 597 GtC (= PgC) by 270 GtC to the present 867 GtC in 2017 is really anthropogenic by nature.
The IPCC writes like this in Technical Summary (Ref. 3 ): “An independent line of evidence for the anthropogenic origin of the observed atmospheric CO2 increase comes from the observed consistent decrease in atmospheric oxygen (O2) content and a decrease in the stable isotopic ratio of CO2 (13C/12C) in the atmosphere (Figure TS.5)”. The IPCC claims that an increase of atmospheric CO2 concentration is univocal evidence about its origin, but it is not – it is cheating. The concentration increase does not show anything about its origin. Another reference to the isotopic ratio of 13C/12C shows that it has been decreasing. This is a piece of evidence, but it is not good enough. This is the only and one place of AR5, where there is a reference to acronyms δ13C and permille and there is also the trend of this measurement in Figure TS.5. The IPCC does not explain what these acronyms are, and the IPCC does show any calculations. The reason is simple. Any further analysis would reveal this cheating. They follow the doctrine of the German philosopher Wittgenstein: “Whereof one cannot speak, thereof one must be silent”. Media and ordinary people do not require any more evidence because they do not know that this result can be analyzed in more detail. I have never noticed that contrarian climate scientists have ever questioned this claim that the CO2 increase in the atmosphere is totally anthropogenic. The isotopes of carbon and the measurement units δ13C and permille
There are two permanent isotopes of carbon molecules. The most common is 12C having 6 positrons and 6 neutrons but 13C has one extra neutron. Isotope 12C is the most common being 98.9 % of all carbon and the rest is 13C. There is also an exceedingly small concentration of unstable isotope 14C, which is radioactive. The measurement unit of 13C proportion (also marked as δ13C) and it is a fraction of carbon isotope 13C expressed as ‰ (written also in the forms per mil, per mill, permil, permill or permille). This unit is linearly dependent on the relationship 13C/12C, Ref. 4.
δ13C = P = (S/N-1) * 1000 (1)
where S = 13C/12C being a sample and N = (13C/12C)standard = 0,0112372. The value of standard comes from a sea fossil by name Belemnitella americana, because it is a stable composition and its 13C concentration is extremely high.
Permille unit is odd because all the values of CO2 mixtures are negative. The atmosphere is the mixture of natural CO2 and the anthropogenic CO2, and the CO2 of the plants. The permille value of natural CO2 in the year 1750 was -6.35‰. This value is from the research studies, which assume that in 1750 the mixing layer of the ocean and the atmosphere were in balance having the same relationship of 13C/12C. This value was measured from the sea organism living in the mixing layer of the ocean a few hundred years ago.
The anthropogenic CO2 means CO2 originating from fossil fuels and they have the same permille value as plants living during the era of Carboniferous from 359 – 299 million years ago, and this value is -28‰. Because the permille value of fossil fuels differentiate so much from the natural permille value, it can be used for calculating the portion of anthropogenic CO2 in the atmosphere.
The IPCC reports that there was 240 GtC of anthropogenic CO2 in the atmosphere in 2011. Because the total CO2 mass was 835 GtC, which means that the percentage portion of anthropogenic CO2 was 100*240/835 = 29 %. The rest of the atmospheric
CO2 can be assumed to be natural CO2 having the permille value of -6.35‰. It is not exactly the correct value as we will see later, but if any higher value would be used, the error would just become greater. I checked that 14-year old boy in the Finnish junior high school could solve the composition calculation as expressed in equation (2).
Permille = ((71) * (-6,5) / 100 + (29 * (-28)) / 100 = -12.6‰. (2)
There is another method using the absolute amounts of 13C and 12C based on the equation (1), because the relationship S can be calculated from this equation
S = (P/1000+1)*N (3)
Using this equation, it can be calculated that the 240 GtC is the sum of 2.5930908 GtC of 13C and 237.406908 GtC of 12C. The natural CO2 is the sum of 6.57031395 GtC of 13C and 588.486861 GtC of 12C. It means that in the atmosphere per the IPCC the relationship 13/12C = 9.1634078/824.836592 = 0.011095905 and according to equation (1) permille value is -12.6‰. Surprise?
Now the final question is what the real permille value of the atmospheric CO2 is in 2011. The measured permille value from different locations is shown in Fig. 1. The Mauna Loa value in 2017 is -8.31‰ and the error is massive.
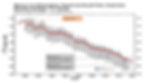
Fig. 1. The permille value trends of South Pole and Mauna Loa from the Scripps Laboratory.
The permille values of Mauna Loa show the same kind of fluctuating feature like concentration measurements due to the seasonal variation of photosynthesis of plants.
A question may be asked that how we know that the portion of non-anthropogenic CO2of the atmosphere has the permille value -6.5‰ nowadays. This is really a simplifying assumption because the permille value has changed a little bit due to the huge recycling fluxes - a totally of about 200 GtC annually. In my own model, I take this change into account. This change can happen only in one direction by decreasing the permille value of this CO2 portion because a greater permille value than -6.5‰ cannot be found in the oceans or in the biosphere. It means that the permille value calculated by a more accurate method for the present atmosphere would be slightly greater making the error of the IPCC and Joos et al. even greater.
I have pointed out that the IPCC has used research results, which are very defective. The question is if I have a better carbon cycle model showing compliance with the observations. I do have. Recently the third version of my model by name 1DAOBM-3 has been published, ref. 5. This model is a four-box model based on 26 physical equations. I have applied Henry’s law by assuming that the atmosphere and the mixing layer are in physical balance concerning the sequestration rate of CO2 into the ocean.
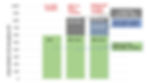
Fig. 2. The composition of atmospheric CO2 according to the IPCC in 2011 and my model 1DAOBM-3.
Le Quere et al. (Ref. 6 , together 83 authors) have reported the values of their carbon cycle model for the year 2018. The fossil CO2 emissions were 425 GtC and it was divided into three different reservoirs: the atmosphere 250 GtC, the oceans 150 GtC, and the biosphere 190 GtC plus the unbalance 25 GtC. The same figures of my model for the year 2017 were: emissions 433 GtC, the atmosphere 73 GtC, the oceans 233 GtC, and the biosphere 127 GtC. The greatest difference in these models is that my model considers the natural CO2 flow from the ocean into the atmosphere being 173 GtC in 2011 and 197 GtC in 2017 but the other models do not consider this flux at all. As one can see in Fig.2 the composition of the atmosphere is natural CO2 597 GtC, CO2 from the ocean 175 GtC, and CO2 from fossil fuels 63 GtC in 2011. This composition gives permille value of -8.38‰ being very close to the observed value of -8.31‰.
An updated figure for the year 2017 has been depicted in Fig. 3. My carbon cycle model is the only model calculating and representing the flux and reservoir values for different types of CO2. Other researchers do not use this approach. You can ask, why not? You can also ask, why the researchers of Joos et al. and Le Quere et al. do not even mention that there is the observed permille value for the atmospheric CO2 composition. The answer is imminent. If they would refer to it, they should also calculate the permille value of their atmospheric composition. They cannot do it, because then the hoax would be exposed. The magician cannot expose his tricks. Otherwise, he would be an ex-magician.
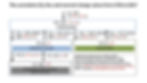
Fig. 3. The cumulative and yearly flux values and the reservoir change values from 1750 to 2017.
I think that the motive for constructing a highly defective carbon cycle model is to get an exceedingly high amount of anthropogenic CO2 to remain in the atmosphere. This leads to awfully long residence times of the anthropogenic CO2. Because the warming effects of natural and anthropogenic CO2 are the same, there would not be any reason for this, but it looks like term “anthropogenic CO2” is a better choice because it shows that humanity is guilty. I have depicted the residence times of Joos et al. (Ref. 2 ) and the Bern2.5CC (the model used by the IPCC in AR4) and my model in Fig. 4.
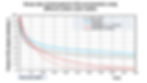
Fig. 4. The impulse responses of three carbon cycle models.
The settling time of my model for the total CO2 is about 300-350 years and the settling times of the other two models are more than 1000 years. The only validation result of Joos et al and Le Quere et al. seems to be the CO2 concentration trend.
I have five different validation results for my carbon cycle model:
1. The anthropogenic amount in the oceans in 1993 has been 118-140 GtC and according to my model, it is 123 GtC.
3. The research results show that the Earth is greening, and the amount of increased vegetation is even up to 158 GtC and my model’s result is 127 GtC.
4. The nuclear bomb tests have been the only full-scale test of humanity with the climate. The residence time of radiocarbon 14C starting to decay in 1964 has been 16 years. This test has been a perfect tracer test for anthropogenic CO2. My model gives the same residence time 16 years for the anthropogenic CO2.
5. My model calculates the atmospheric CO2 concentration starting from the year 1750. The standard error is 0.79 ppm and the coefficient of correlation is 0.999. My model does not use real CO2 concentration but uses CO2 emissions only.
6. The model-calculated permille value in the atmosphere follows the observed permille values very well.
References
Ref. 1. IPCC, Assessment Report 5, p. 467.
Ref. 2. Joos, F., Roth, R., Fuglestvedt, J.S., Peters, G.P., Enting, I.G. et al., 2013. Carbon dioxide and climate impulse response functions for the computation of greenhouse gas metrics: a multi-model analysis. Atmos. Chem. Phys. 13: 2793–2825. DOI:10.5194/acp-13-2793-2013.
Ref. 3. IPCC, AR5, Technical Summary, Chapter 2, pages 50-52. https://www.ipcc.ch/site/assets/uploads/2018/02/WG1AR5_TS_FINAL.pdf
Ref. 4. Permille number. Wikipedia. https://en.wikipedia.org/wiki/%CE%9413C
Ref. 5. Ollila, A. Analysis of the simulation results of three carbon dioxide (CO2) cycle models. Ph. Sc. Int. Jl. 23(4), 1-19, 2020. http://www.journalpsij.com/index.php/PSIJ/article/view/30168.
Ref. 6. Le Quere et al., 2018. Global carbon budget 2018. Earth Syst. Sci. Data, 10, 2141–2194, 2018


